At ANZDATA, we are committed to consumer and community engagement in health and medical research.
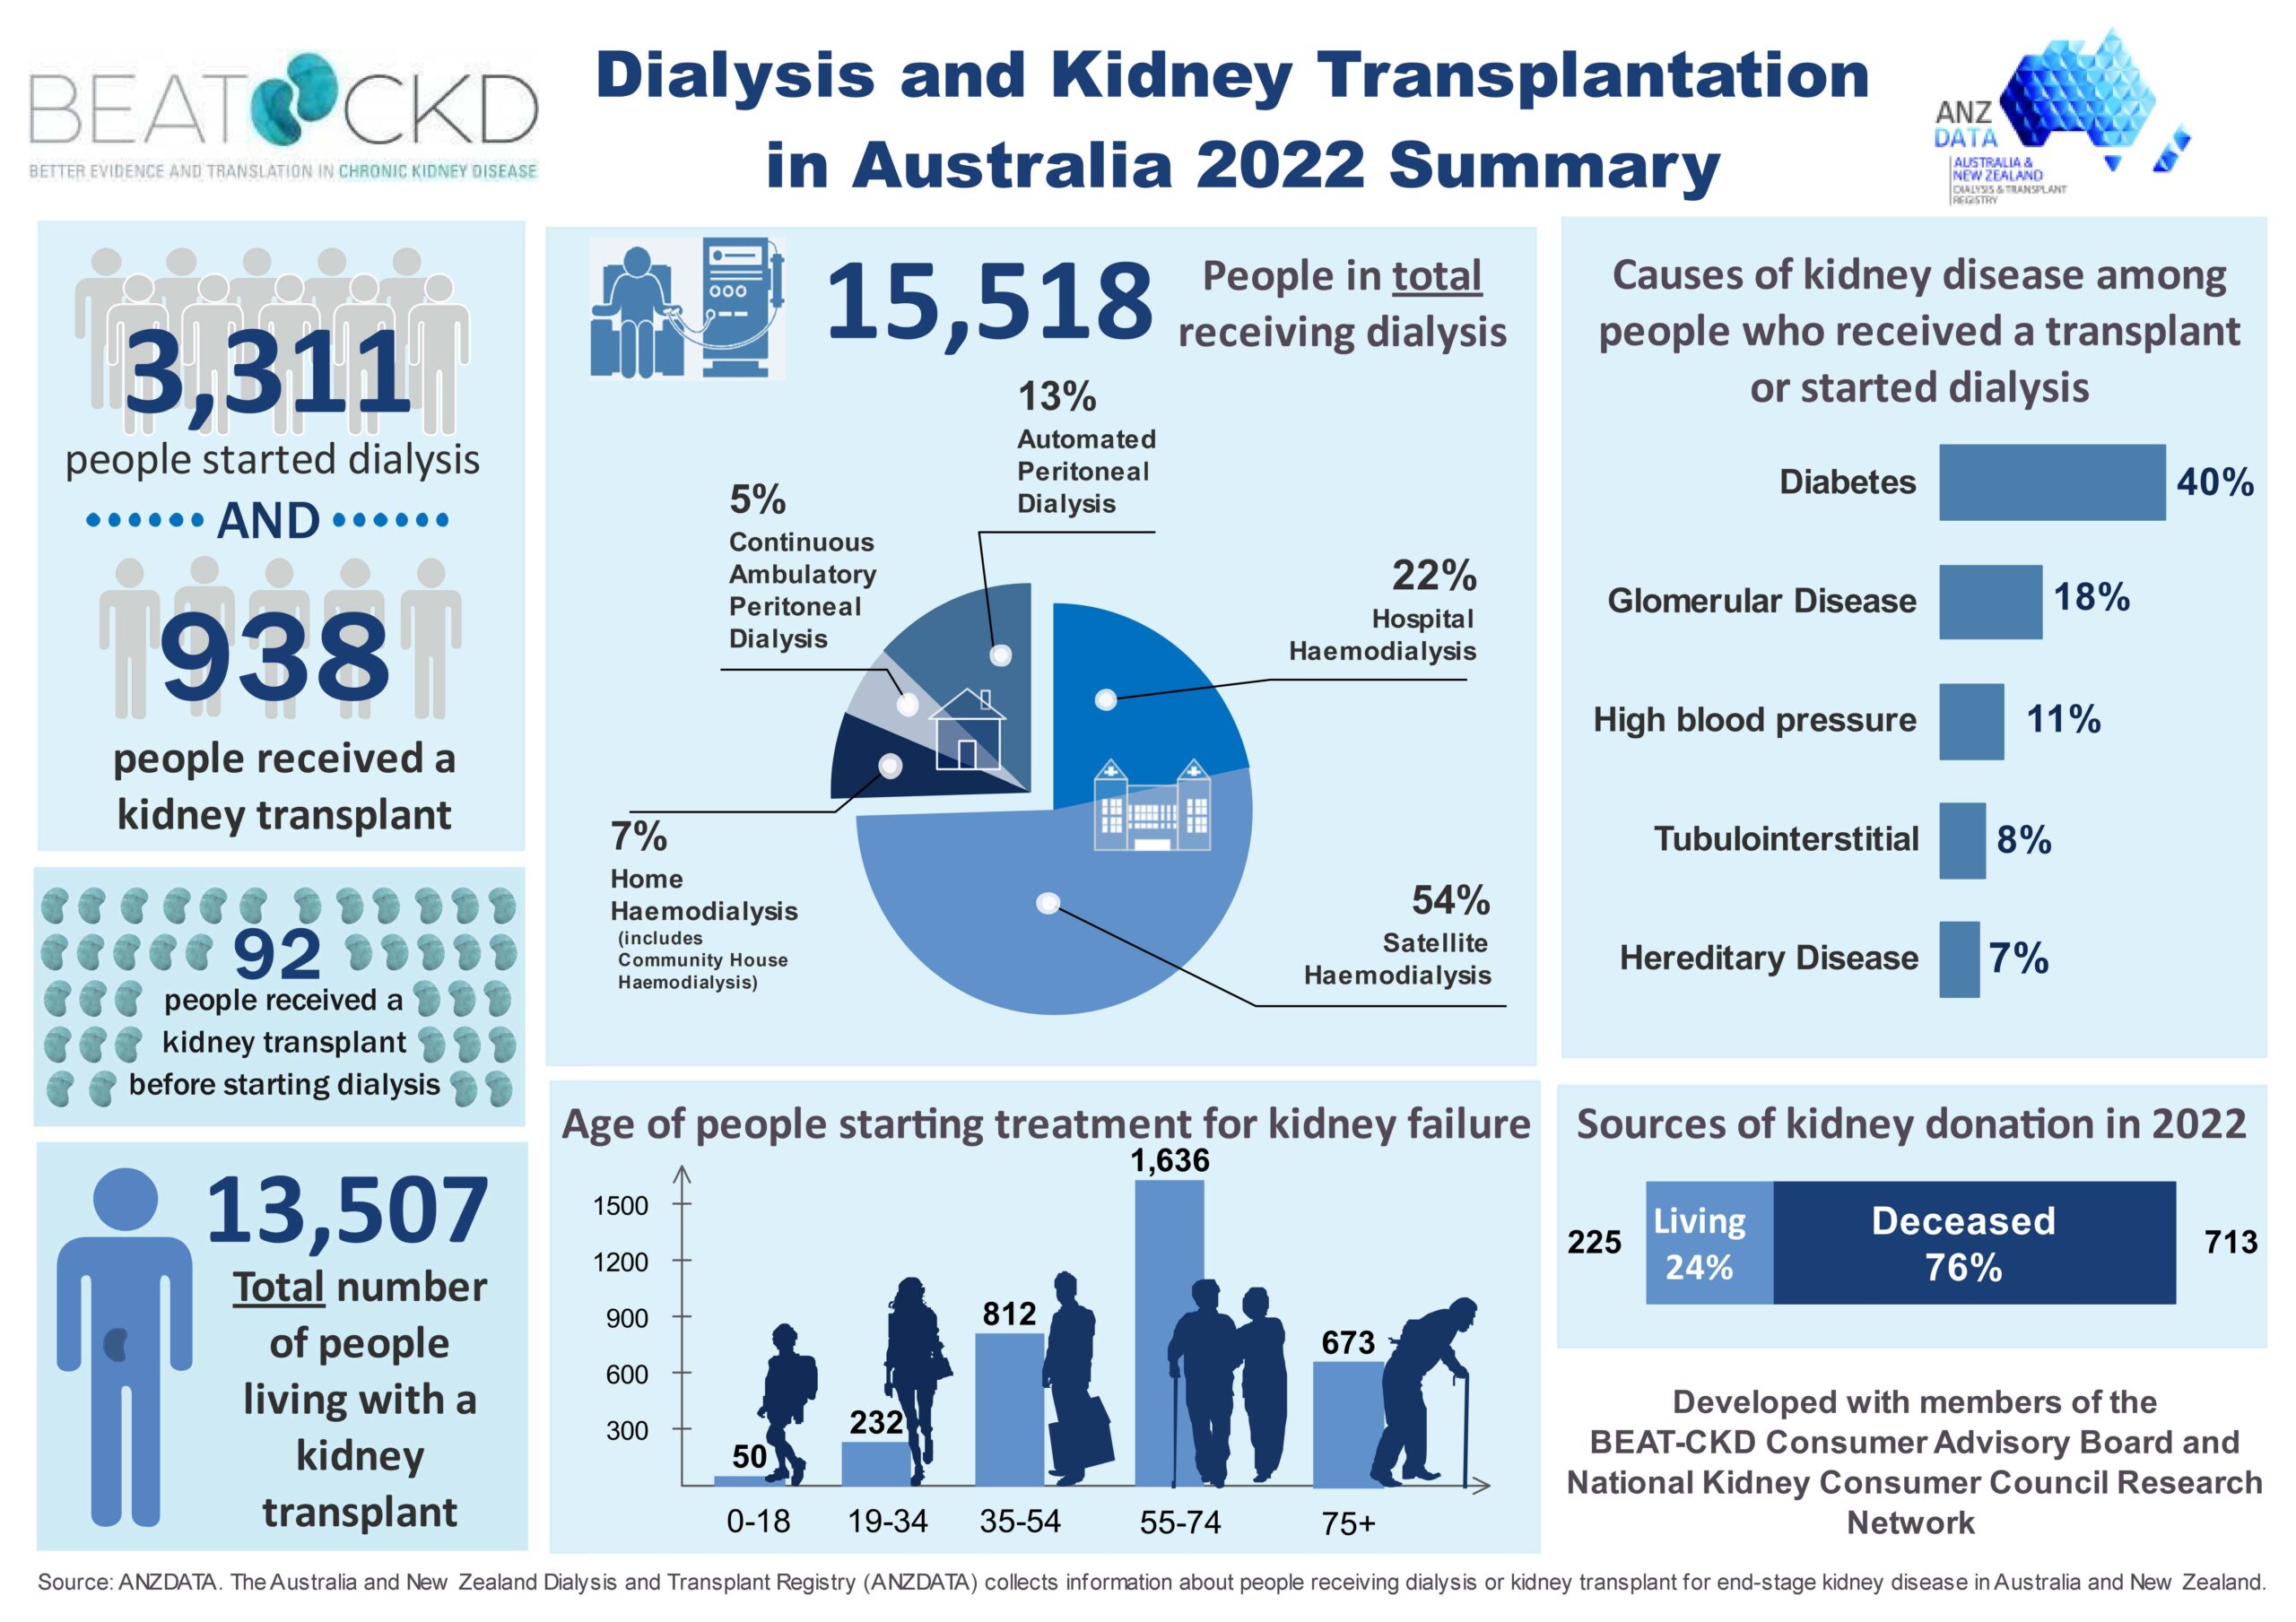
ANZDATA in collaboration with BEAT-CKD developed this information sheet with consumer involvement, to provide practical information and understanding of Dialysis and Transplantation in Australia as collected by the ANZDATA Registry.
Catching Some AIR Project Infographics
Asserting Aboriginal and Torres Strait Islander Information Rights in Renal Disease
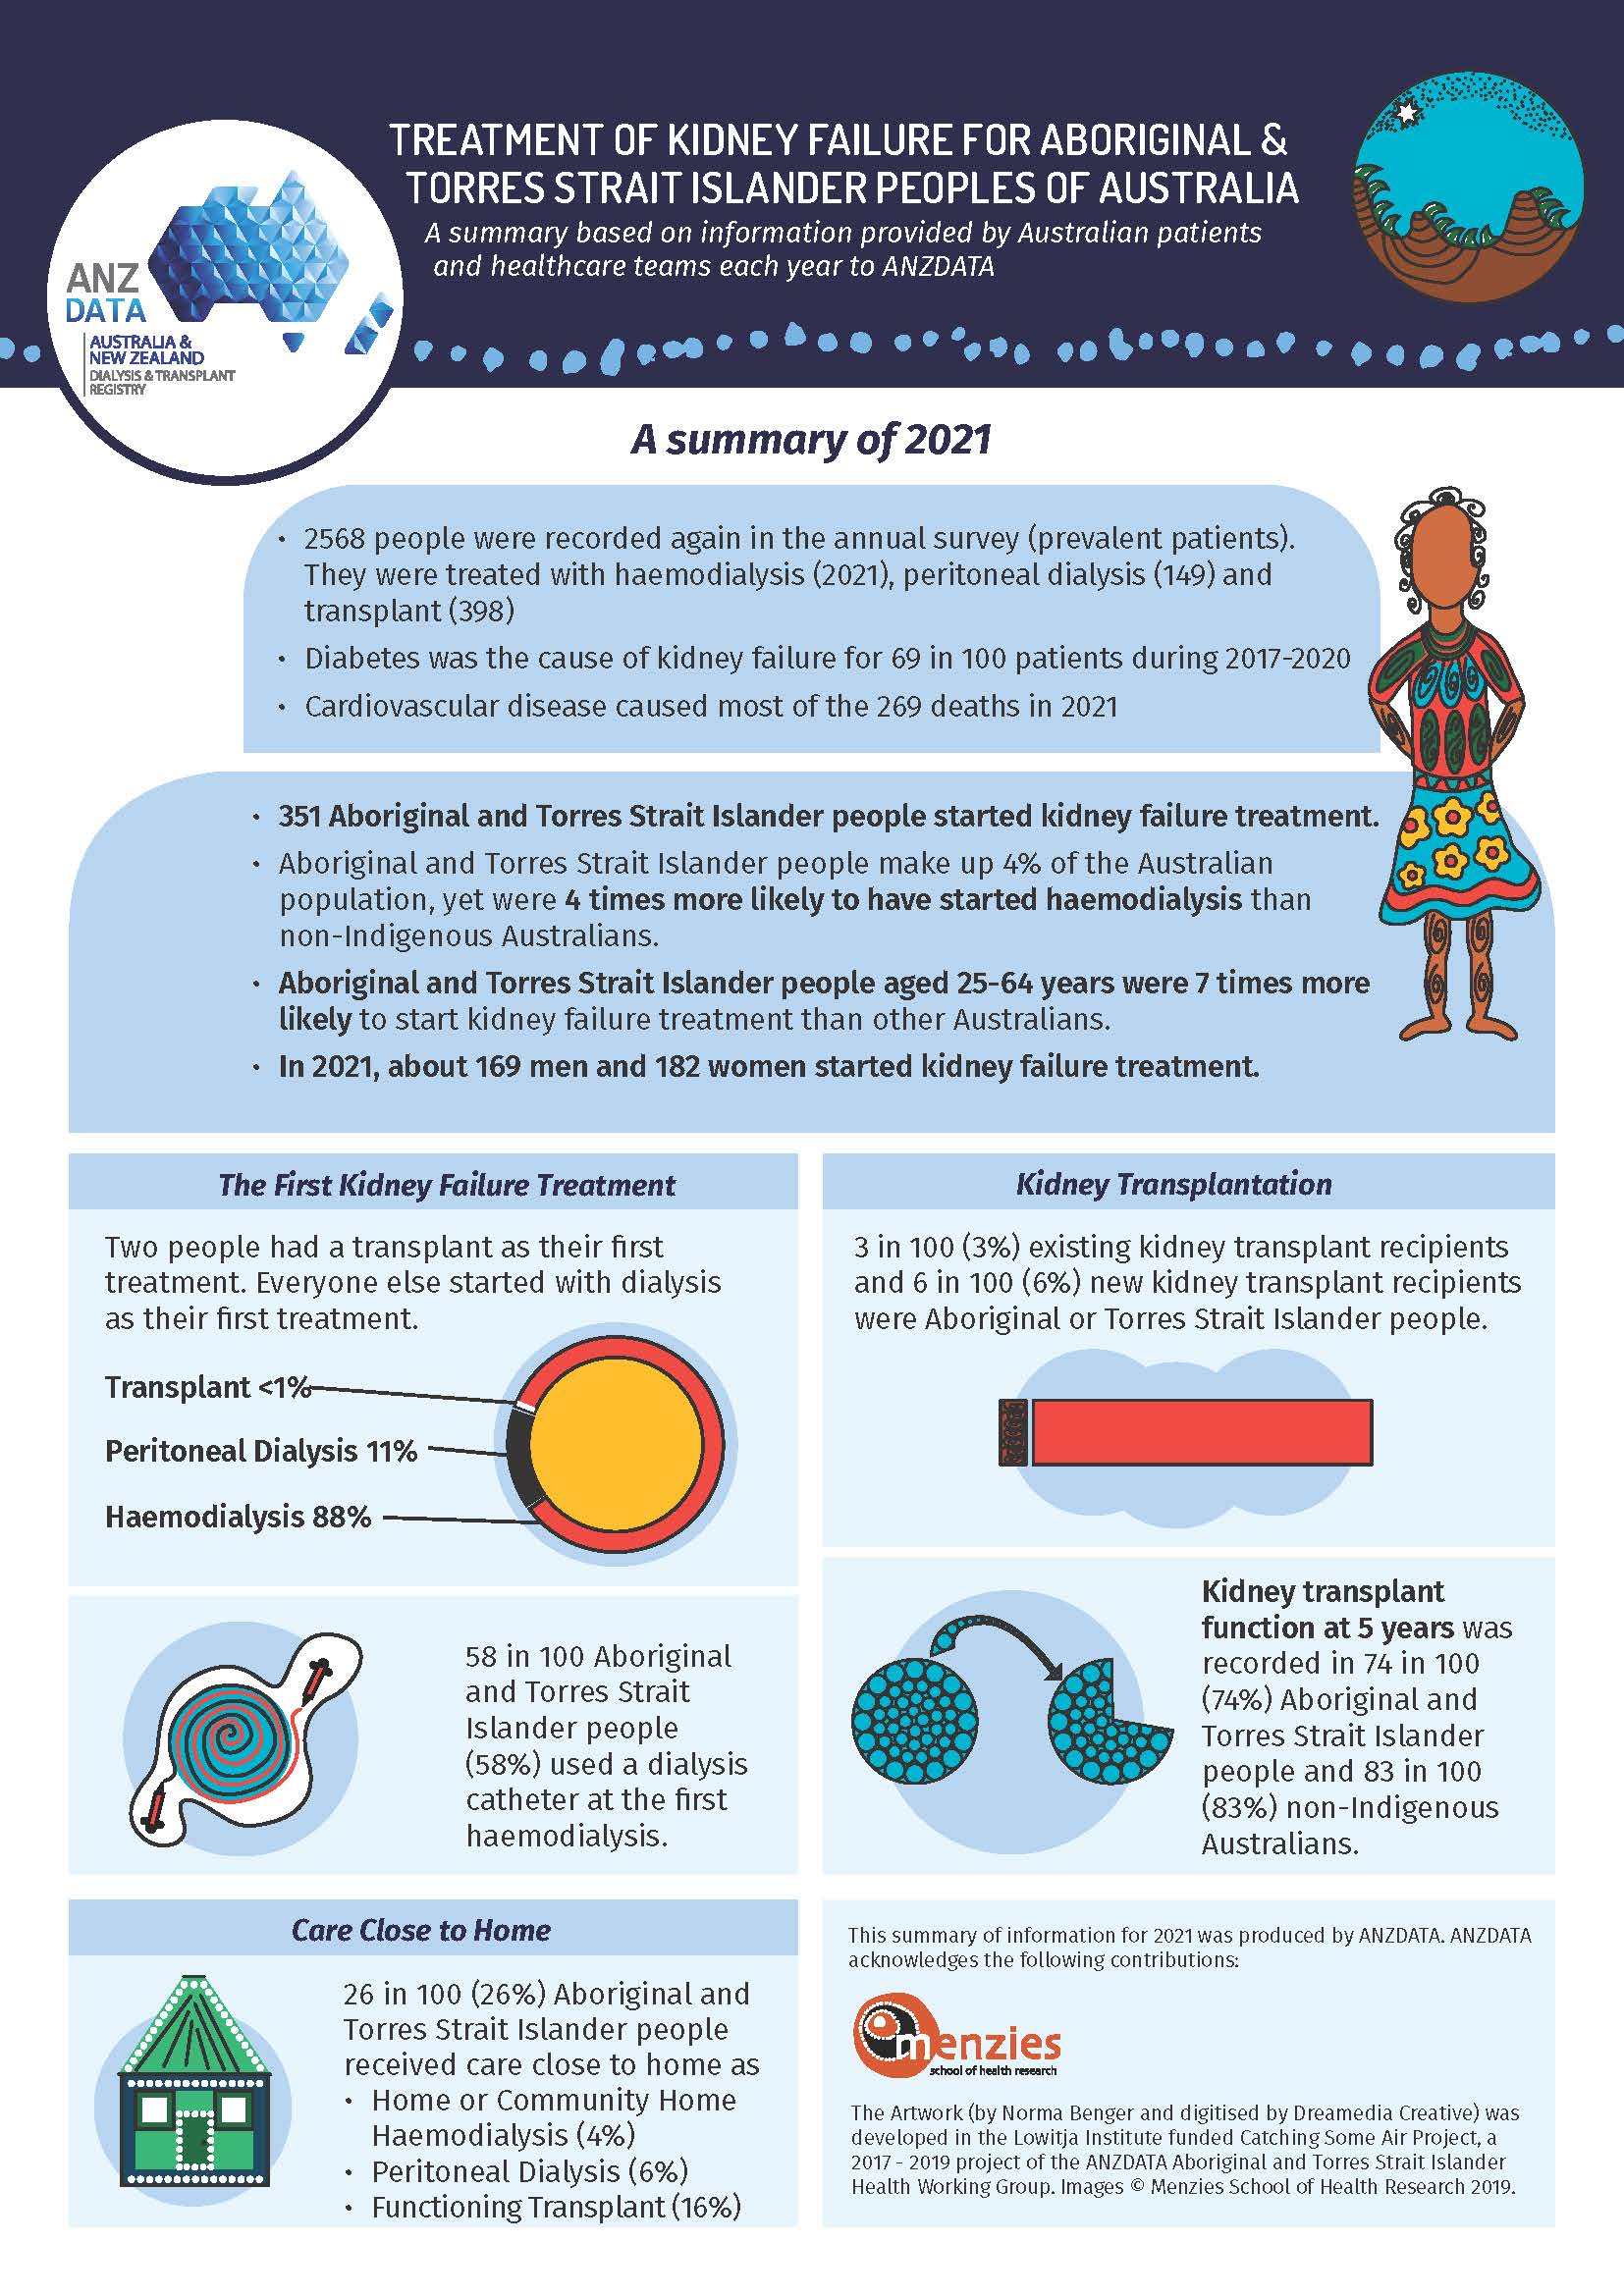
Treatment of kidney failure for Aboriginal and Torres Strait Islander Peoples of Australia – A summary based on information provided by Australian patients and healthcare teams each year to ANZDATA
This infographic describes key information about patients in 2020, who received dialysis treatment or who were living with a kidney transplant. ANZDATA has committed to publishing an infographic in this format for five years. It has primarily been developed to be used by people who currently require dialysis or transplant care. It can also be used by family members of patients, health care staff, health service managers and health policy teams.
Acknowledgment goes to ANZDATA team who assisted with data analysis and interpretation for this infographic – Dr Chris Davies, Dr Mark Tiong, Ms Donisha Duff, Associate Professor Jaqui Hughes, Dr Namrata Khanal, Dr Phil Clayton, Ms Kylie Hurst, Prof Stephen McDonald.
ANZDATA thanks the Lowitja Institute who funded the artist, Ms Norma Benger, as part of the Catching Some Air- Asserting Aboriginal and Torres Strait Islander Information Rights in Renal Disease Project, to create and/ or adapt some of the icons in the infographic.